I Built a Graph Explorer for Obsidian Bases. Here's Why LLM Wikis Need a Visual Layer
I built Graph Explorer Base View to solve a real problem: LLM Wikis generate tons of interconnected notes, but without a visual layer, you can't see clusters, gaps, or what still needs review.


You can build a knowledge base entirely with AI. But without a way to see it, you're flying blind.
In this article, I want to share why I created the Graph Explorer Base View plugin for Obsidian, and why I believe any serious LLM Wiki setup needs a visual layer to be truly useful.
Introduction
A few days ago, Andrej Karpathy shared an idea that resonated with a lot of people: let Large Language Models (LLMs) handle the boring parts of building a knowledge base. Write the summaries. Maintain the cross-references. Keep the index clean. The concept is called an LLM Wiki, and it's a pattern where the AI does all the work.
I've added support for this pattern to the Obsidian Starter Kit, and am now having fun asking AI to create such embedded "wikis" right inside of my Obsidian vault. For instance to research certain topics, search for solutions to my problems, ideas to explore, etc.
I've been using this pattern in my own Obsidian vault. And it works. The LLM ingests sources, writes articles, links them together, and maintains consistency across hundreds of pages. If you want to see a concrete example, I've published my PKM wiki openly.
The problem? Once you have 50+ articles with dense cross-references, you lose the big picture. You can't see clusters. You can't spot gaps. You don't know which articles still need review.
The wiki works great. But it's hard to explore systematically.
That's why I built the Graph Explorer Base View plugin for Obsidian.
I'll discuss the architecture and specific way in which I'm embedding and leveraging such wikis in another article.
TL;DR
- LLM Wikis generate tons of interconnected notes, but flat file lists make it hard to see the big picture
- Obsidian's built-in graph view shows topology but has no metadata awareness, no exploration tracking, and no scoped queries
- Graph Explorer Base View renders any Obsidian Base as an interactive force-directed graph
- Nodes can be colored by confidence level, maturity, explored status, tags, or any frontmatter property
- Built-in exploration tracking lets you mark articles as reviewed and monitor your coverage
- Maturity pipeline tracking shows which articles are stubs, drafts, substantial, or mature
- Frontier nodes reveal where your wiki has gaps the LLM could fill
- Graduated notes indicator shows which wiki articles have produced permanent knowledge
- Four built-in presets for different workflows: LLM Wiki Explorer, Exploration Progress, Role Overview, Maturity Pipeline
- The plugin turns a flat file structure into a navigable, visual knowledge graph
By the way, this plugin can actually be used to review any set of notes in your knowledge base.
The problem: LLM Wikis are great, but you can't see them
The LLM Wiki pattern works like this. You point an LLM at raw sources (articles, papers, repos, transcripts). It extracts key ideas, writes wiki-style articles, creates cross-references, and maintains an index. Three operations keep it alive: ingest (process new sources), query (search and synthesize), and lint (health-check for contradictions and orphans).
The result is a collection of Markdown files with dense wikilinks between them. And that's where the trouble starts.
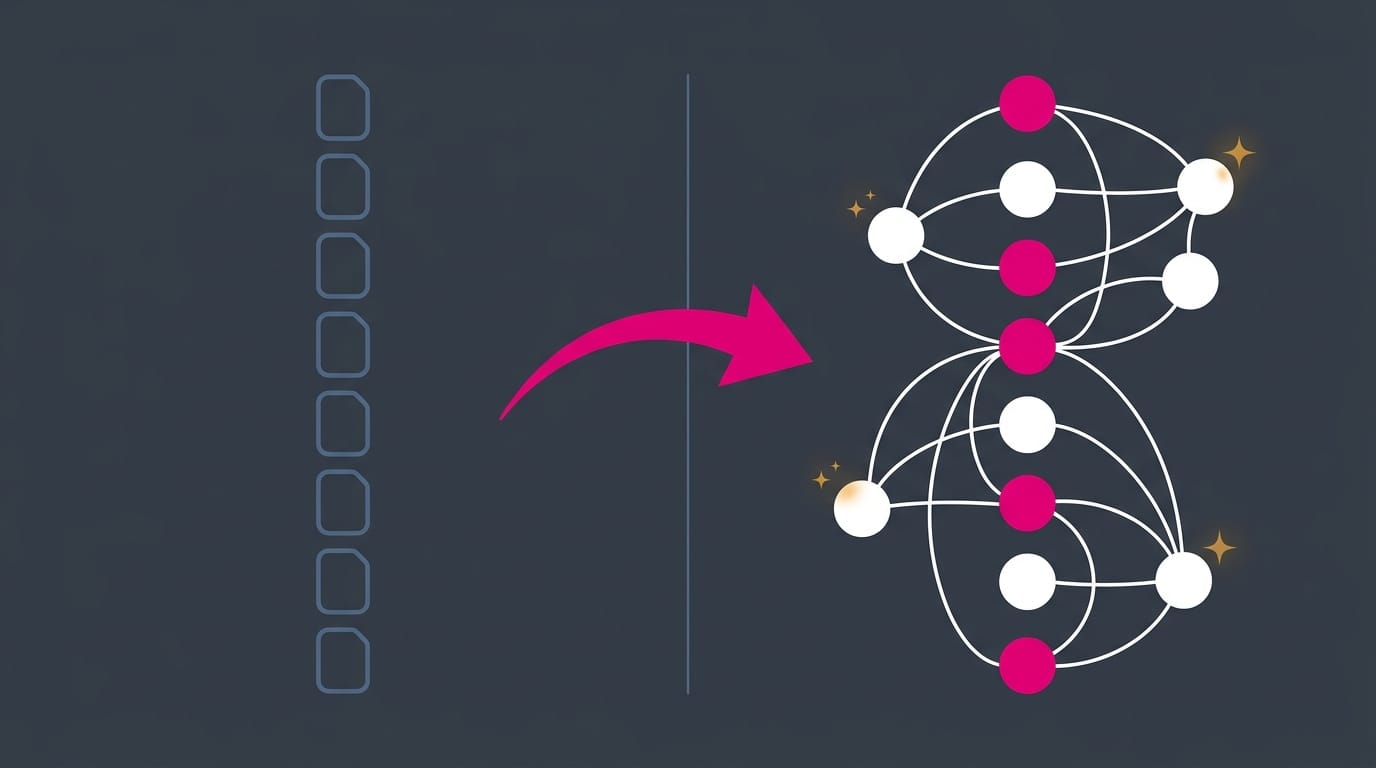
Markdown files are flat. You can search them. You can browse them one by one. But you can't see the shape of your knowledge. You can't tell at a glance which clusters are well-developed and which are thin. You can't see which articles the LLM generated last week that you still haven't reviewed. You can't spot the frontier: the edges where unresolved links point to articles that don't exist yet.
This matters because the whole point of the LLM Wiki is that the AI handles bookkeeping so humans can focus on curation. But curation requires awareness. And awareness requires being able to see what you've got.
The metadata layer
If you're going to let an LLM generate content in your vault, you need a way to distinguish AI-written notes from your own, and to track quality signals at a glance. Every article in my LLM Wikis carries structured metadata in its frontmatter:
ai_generated: truemarks notes the LLM created. This is non-negotiable. You should always know what was written by a human and what wasn't.explored: falsestarts every new article as unreviewed. Only I flip it totrueafter I've actually read it.confidence: high | medium | low | uncertainrecords how well-sourced an article is. The LLM sets this based on the quality and quantity of its sources.maturity: stub | draft | substantial | maturetracks writing depth. A stub is a placeholder. A mature article has been deepened, cross-referenced, and sourced properly.wiki_role: article | index | log | source_summarydescribes the structural function of each note.graduated_noteslists any permanent notes extracted from the article into the main vault.sourcestracks where the information came from (vault notes, web research, Readwise highlights, etc.).
This metadata is what turns a pile of Markdown files into something you can actually reason about visually. Without it, every node in a graph looks the same. With it, you can color nodes by confidence, shape them by role, filter by explored status, and track maturity across the entire collection. The plugin reads all of this directly from the frontmatter.
"But Obsidian already has a graph view?"
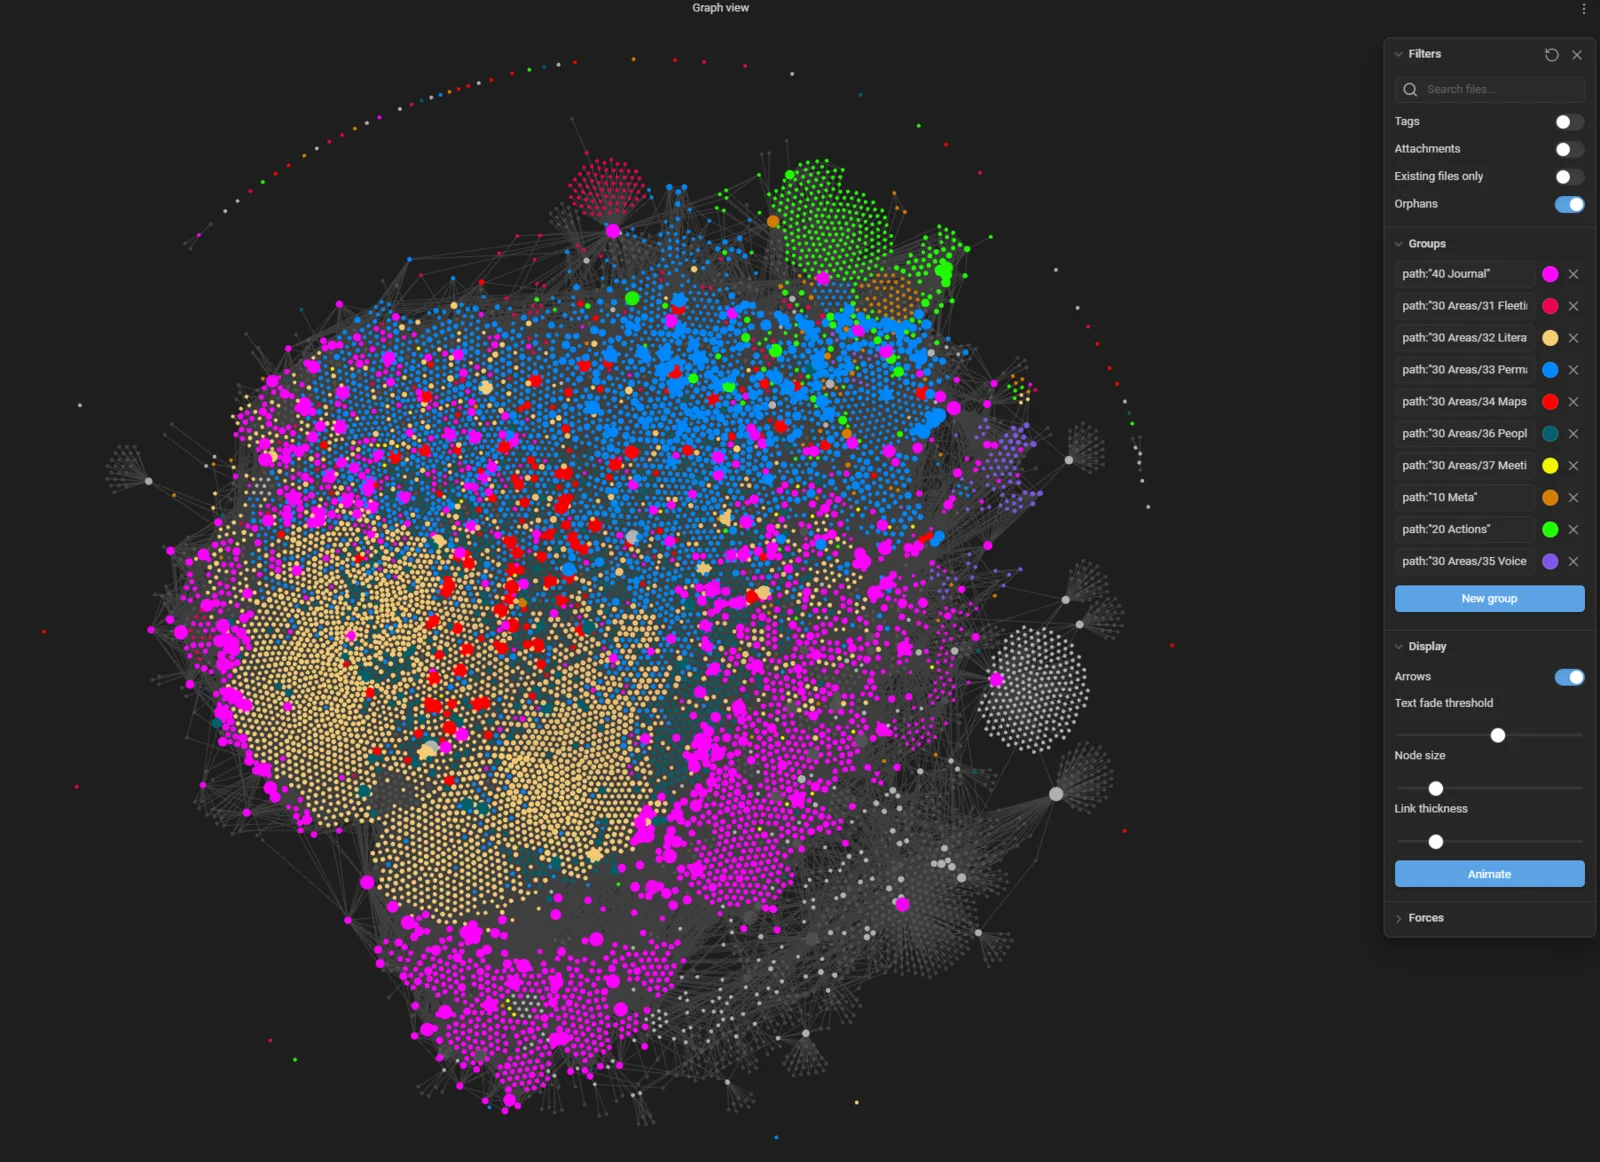
It does. And if you've ever opened it on a vault with more than a few hundred notes, you know the problem: it shows everything. Your entire vault, every note, every link, all at once. It's like looking at a city from orbit. Pretty, but not useful for getting around.
The built-in Obsidian Graph view is a topology viewer. It answers one question: "what links to what?" That's it. You can filter by folder or tag, change some colors, and... that's about where it stops.
What it can't do:
- No metadata awareness. It doesn't know about your frontmatter. It can't color nodes by confidence level, maturity, creation date, or any custom property. Every node looks the same regardless of its state.
- No exploration tracking. There's no way to mark a note as "reviewed" and track your progress across a collection. When your LLM generates 30 new articles, the built-in graph gives you zero help figuring out which ones you've actually looked at.
- No scoped queries. It shows the whole vault or a filtered subset, but it doesn't integrate with Obsidian Bases. You can't say "show me only the notes matching this Base query" and get a focused graph of exactly that dataset.
- No side panel. Click a node and it opens in a new tab. You lose the graph context. There's no way to read a note while keeping the graph in view.
- No frontier nodes. Unresolved links are invisible. You can't see where your knowledge has gaps.
- No batch operations. You can't select multiple nodes and toggle a property on all of them.
- No keyboard navigation. No Tab cycling, no arrow key neighbor traversal.
- No position memory. Arrange nodes carefully, close the view, reopen it; everything resets.
The built-in graph is fine for a quick birds-eye view of your vault. But it was never designed for curation workflows. It doesn't help you track what you've reviewed, assess quality, or find where to focus next.
Graph Explorer Base View was built specifically for that.
Graph Explorer Base View plugin
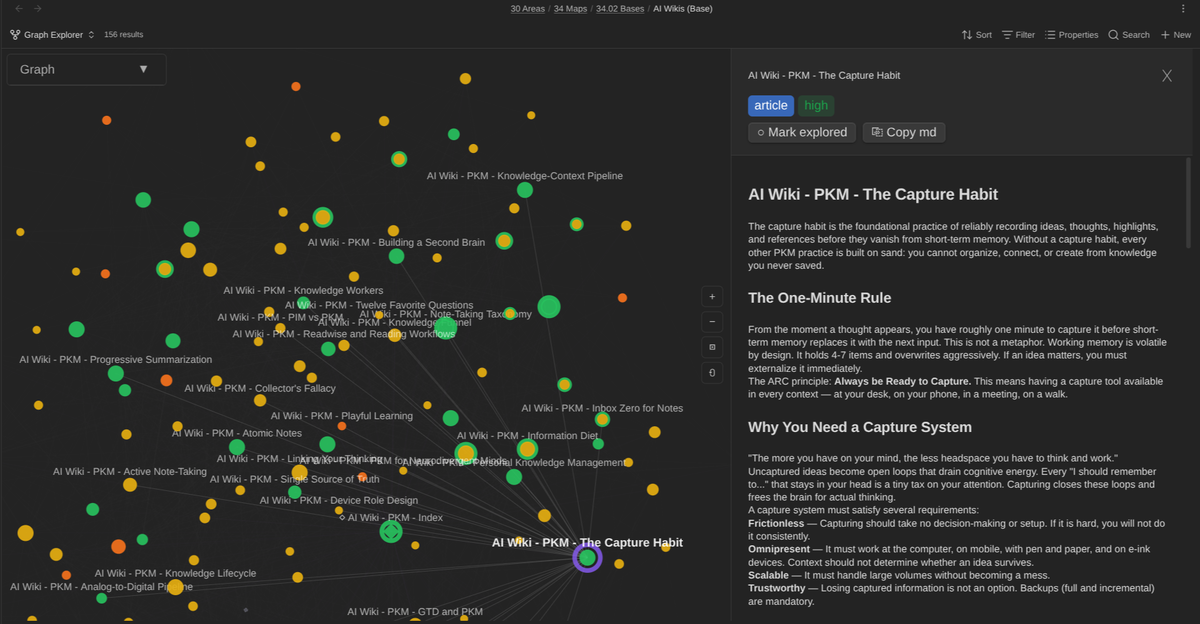
Graph Explorer Base View is an Obsidian community plugin that renders any Obsidian Base as an interactive force-directed graph. Each note becomes a node. Each wikilink becomes an edge. You can drag, pan, zoom, and click into any node to read its content in a side panel.
It's more than a pretty graph, though. I designed it specifically for the LLM Wiki workflow, and it includes features that make it a real curation tool.
Exploration tracking
Every node shows whether you've reviewed it or not. Explored nodes appear solid with a green border. Unexplored ones are hollow. A progress bar at the top shows your overall coverage. When the LLM generates 20 new articles in a single ingestion session, you can see exactly how many you've reviewed and how many are still waiting.
I find that valuable, because it enables me to see at a glance what I have yet to review.
Confidence and maturity coloring
The LLM Wiki Explorer preset colors nodes by confidence level (high, medium, low, uncertain). This immediately surfaces under-sourced or shaky articles that need attention. The Maturity Pipeline preset colors by depth: stub, draft, substantial, or mature. You can set maturity directly from the graph; right-click a node or use the side panel dropdown.
Frontier nodes
Unresolved wikilinks appear as frontier nodes in the graph. These are articles that are referenced but don't exist yet. They show you exactly where your wiki has gaps. Places where the LLM could fill in knowledge through a new ingestion pass.
Graduated notes tracking
A small purple dot on a node means permanent notes have been extracted from that article. This closes the curation loop: the LLM writes a wiki article, you review it, and when it contains ideas worth keeping permanently, you graduate them into your main vault. The graph shows at a glance which articles have been mined for lasting knowledge and which still hold ungathered value.
Rich visual encoding
Three visual channels keep things clean. Fill color shows the property you've selected (confidence, maturity, tags, creation date, or any custom frontmatter property). Shape shows wiki role (circles for articles, diamonds for index pages, squares for logs, hexagons for source summaries). Solid vs hollow shows explored status. No stacking, no clutter. A toggleable color legend explains what everything means.
Keyboard navigation and batch operations
Tab cycles through nodes, arrow keys navigate neighbors, Enter selects, Escape clears. You can batch-toggle explored status or set maturity on multiple nodes at once. This makes systematic review sessions fast.
Position persistence and context
Drag a node somewhere meaningful and it stays there when you reopen the view. Shift+drag moves a node along with all its direct neighbors, so you can arrange entire clusters at once. External nodes show notes linked from your wiki but outside the current Base query; you see how the wiki connects to the rest of your vault without losing focus.
This is a simple Mind palace.
Getting started
- Install Graph Explorer Base View from the Obsidian community plugins browser (Settings > Community plugins > Browse) (not available yet), manually (download a release from the Releases page), or using the BRAT plugin for Obsidian
- Create an Obsidian Base that queries your wiki notes (or any folder of interconnected notes)
- Open the Base, then click the graph icon to switch to the Graph Explorer view
- Start exploring
The plugin works with any Obsidian Base. You actually don't need an LLM Wiki to use it. But it shines brightest when you have a densely linked collection of notes with metadata to visualize.
How it fits the workflow
The typical cycle looks like this:
- Ingest new sources through the LLM. It writes articles, updates cross-references, and logs everything
- Open Graph Explorer on your wiki's Base. New articles appear as hollow (unexplored) nodes
- Visually scan for clusters, orphans, and frontier nodes. Identify what needs attention
- Click into nodes to read them in the side panel. Mark them explored as you go
- Check confidence using the LLM Wiki Explorer preset. Fix or flag uncertain articles
- Track maturity using the Maturity Pipeline preset. Deepen stubs into drafts, drafts into substantial articles
- Spot gaps through frontier nodes. Queue those topics for the next ingestion pass
- Graduate knowledge when an article contains ideas worth keeping permanently, extract them. The purple dot tells you which articles have already been harvested
The LLM does the writing. You do the seeing.
And don't misinterpret, the goal is NOT to have AI replace your thinking. The goal is really to help you research & explore new ideas more quickly. Then, you can pick the pieces you find valuable, and think/write yourself about those, connecting to other ideas in your knowledge base.
Beyond LLM Wikis: reviewing any set of notes
I built this plugin for LLM Wikis, but it works with any Obsidian Base. This is important.
An Obsidian Base is just a query that returns a set of notes. It could be your LLM Wiki articles. It could also be all your literature notes, all your project notes, all notes tagged with a specific topic, or all notes created in the last 30 days. Whatever the Base returns, Graph Explorer can visualize.
Some examples of what you could do:
- Review your permanent notes by creating a Base that queries your main knowledge collection. Color by creation date to see which areas have recent activity and which have gone stale.
- Map a research topic by querying notes with a specific tag. The graph shows you how your thinking is structured and where the gaps are.
- Audit your vault's health by visualizing a folder and looking for orphan nodes (no connections) or overly central hubs (too many connections, likely needs splitting).
- Track a reading project by creating a Base that queries your book notes or literature notes. Use the exploration toggle to mark which ones you've processed.
Any frontmatter property can be used for coloring, not just the LLM Wiki specific ones. If your notes have a status, priority, type, or any other custom field, the plugin can visualize it.
The LLM Wiki workflow is the most complete use case because it generates all the right metadata out of the box. But the plugin doesn't care where the metadata comes from. If you have it, Graph Explorer can show it.
Going Further
If you're new to Obsidian, I wrote about why I think it's the best tool for this kind of work in a previous article.
I've also shared how I use AI with my vault every day in another article.

And if you're interested in the broader vision of AI-powered knowledge management, check out my article on Agentic Knowledge Management.

Graph Explorer Base View is open source. You can find it on GitHub.
Conclusion
LLM Wikis are a big deal. An AI that maintains a living, cross-referenced knowledge base while you focus on asking better questions? Yes please. But that value gets lost if you can't see what the AI has built.
Graph Explorer gives you eyes. It turns hundreds of interconnected Markdown files into a visual map you can navigate, review, and curate. It closes the gap between "the LLM wrote it" and "I trust it."
I built it because I needed it. I hope you find it useful too.
That's it for today! ✨
About Sébastien
I'm Sébastien Dubois, and I'm on a mission to help knowledge workers escape information overload. After 20+ years in IT and seeing too many brilliant minds drowning in digital chaos, I've decided to help people build systems that actually work. Through the Knowii Community, my courses, products & services and my Website/Newsletter, I share practical and battle-tested systems.
I write about Knowledge Work, Personal Knowledge Management, Note-taking, Lifelong Learning, Personal Organization, Productivity, and more. I also craft lovely digital products and tools.
If you want to follow my work, then become a member and join our community.
Ready to get to the next level?
If you're tired of information overwhelm and ready to build a reliable knowledge system:
- 📚 KM for Beginners — 10+ hours of structured video lessons
- 🚀 Obsidian Starter Kit — Ready-made vault with 40+ templates
- 💼 Knowledge Worker Kit — Complete guides + lifetime community
- 🦉 1-on-1 Coaching — Personalized guidance
- 🎯 Join Knowii — Community + ALL courses & tools
Found this valuable? Share it with someone who needs it.