How I Turned 20,000 Notes Into Live Dashboards With Obsidian Bases
A Base isn't a spreadsheet you fill in. It's a lens you point at notes you already have, and it's only as sharp as the properties underneath. Here's how I run live dashboards over 20,000 notes.

In this article, I want to show you what Obsidian Bases are, how to build your first one in two minutes, and how I use them to run live dashboards across a vault of more than 20,000 notes. I'll share real use cases from my own setup: my reading library, my life/health tracking system, the custom Base views I built as Obsidian plugins, and an "AI Base" that indexes the AI agents living inside my vault.

TL;DR
- Your vault is already a database. Every property you've ever typed into a note is data. Bases are how you finally query it, with no spreadsheets to keep up to date.
- Less filing, more asking. A Base is a saved question ("what am I reading right now?", "which days did I sleep badly?") that answers itself and stays current forever. You change a property; the dashboard updates on its own.
- One question, a dozen views. The same Base becomes a table, a card gallery, a bookshelf, or a graph. Build the query once, look at it however the moment needs.
- Clean properties are the whole game. Bases reward consistent metadata and expose sloppy metadata. Get this right and everything else follows. Get it wrong and no view will save you.
- Formulas turn lists into dashboards. Compute a wellness score, a reading streak, a "this week / this month" bucket. Columns that live in no note but appear on demand.
- Faster and friendlier than Dataview. Native, editable in place, quick even at 20,000 notes. I've moved most of my dashboards over.
- It goes far past tables. Plugins can add whole new view types (I built three: charts, periodic reviews, and a knowledge graph), the Obsidian CLI can query Bases from your terminal, ...
- You can have AI build and improve them for you. Describe the dashboard you want in plain English and let the AI write the Base.
What an Obsidian Base actually is
Obsidian Bases is a core Obsidian plugin (no installation needed) that turns any set of notes into a database you can filter, sort, and view in different ways. Think of it as a saved question you ask your vault. "Show me every book I'm currently reading." "Show me my daily notes from this week with their sleep scores." "Show me every AI skill I've written, grouped by category."
The key part: you don't fill a Base with data. The data already lives in your notes, in their properties (also called frontmatter or metadata). A Base just reads it.
It's a bit like databases in Notion, except a gazillion times faster, and your data stays as plain Markdown files you fully own (cfr File over app principle).
Each Obsidian Base does three things:
- Filters decide which notes are included (for example, "has the tag
book"). - Views decide how those notes are displayed (table, cards, and more).
- Properties and formulas decide which columns show up, and what they're called.
That's the whole model.
Your first Base in two minutes
Let's build one. Say you want a list of every book in your vault.
First, a quick setup check. Bases ships with Obsidian, but it's a core plugin, so it might not be turned on yet. Open Settings → Core plugins and make sure Bases is enabled. While you're there, enable the Properties core plugin too. It gives you a clean editor for the frontmatter your Bases will read, and trust me, you'll want it.
- Create the Base. Right-click in the file explorer and choose New base, or run the Bases: Create new base command from the command palette. You get a
.basefile. - Add a filter. By default, Bases include all the notes in your vault. Use filters to select/exclude notes in the Base. Use File → has tag and pick your book tag. Now the Base shows only your book notes.
- Pick your columns. Open the Properties menu and tick the properties you want to see: author, status, rating, pages, reading status, ...
- Sort it. Sort by rating descending, or by date finished.
That's a working database over notes you already had. No data entry. You just pointed a lens at existing notes.
A few things worth knowing early:
- You can create a Base from the ribbon, the command palette, or by right-clicking a folder.
- Bases: Insert new base drops a Base directly into the note you're editing.
- Click the result count next to the view name to limit results, copy them, or export to CSV.
- Click the
</>button next to a filter to reveal the raw syntax. That's where formulas and advanced filters live, and where we're heading.
The mental model: one Base, many views
A common beginner instinct is to create a new Base for every situation. Books to read here, books being read there, books finished somewhere else. Three Bases, three files, three things to maintain.
Don't. Create one Base for books, then add many views to it.
Each view in a Base has its own layout, its own sort, its own filters, and its own columns, but they all draw from the same underlying "root" query. My Books Base has a Bookshelf view, a "Currently Reading" table, a cards gallery, a "Read This Year" table with totals, and separate fiction and non-fiction galleries. One file. Six views.
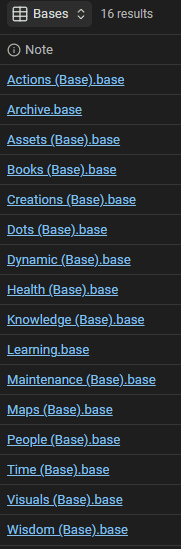
Views are cheap. Bases are the thing you maintain. I have around 20 Bases at the moment, helping me maintenance, project/task management, life tracking, reading, learning, publishing, and more!
Whenever you think "I need another Base", ask first whether you actually just need another view on a Base you already have.
TIP: You can switch views from the dropdown at the top, reorder them by dragging (the first one is the default).
Filters work like a funnel: base-wide vs per-view
There's a subtlety in that "root query" idea that's worth making explicit, because it's exactly what makes the "one Base, many views" model click. Bases give you two layers of filters, and they stack like a funnel.
- Base-wide filters sit at the wide mouth of the funnel. They apply to every view at once and decide which notes even enter the Base in the first place.
- View filters sit below. Each view inherits the base-wide filters automatically, then adds its own on top to narrow the set further.
My Books Base is the clearest example. The base-wide filter keeps only notes tagged book. That set flows down into every single view. My "Currently Reading" view inherits those book notes, then adds its own filter for status is Reading. My "Read This Year" view inherits the same book notes, then filters for a finish date since January 1st. One wide filter at the top; a different narrow filter per view underneath.
Get this right and you stop repeating yourself. You never re-state "only books" in five different places; you say it once at the base level, and every view refines from there. Change the base-wide filter and all your views update at once. Change a view filter and only that view moves.
One filter type beginners often miss: checkbox properties. A property that holds a true/false value (a checkbox in the Properties editor) can drive a filter directly. Add a favorite checkbox to your notes, create a view that filters for favorite is true, and you've got an instant "favorites" view with no new tags and no extra metadata. Booleans are the cheapest filter you can add.
Embedding a Base inside a note
A Base doesn't have to live in its own file that you open like a separate tab. You can drop it straight into any note, the same way you embed an image.
- Embed the whole Base with
![[Books.base]]. It renders inline, fully interactive. - Embed one specific view with
![[Books.base#Currently Reading]]. The part after#is the view name, so you can place different views of the same Base in different notes. - The same works in Canvas. Drop a Base on the canvas, and right-click the file name to pin a specific view.
I use this a lot. My weekly review note embeds my tasks Base. My reading note embeds the "Currently Reading" view. The data sits right where I'm already working, live, instead of in a separate tab I have to go open.
You can also dock a Base into a pane. Open a .base file, then drag its tab to the right edge of the window (or any pane) to keep it on screen while you work in the main pane. Combined with the this keyword (more on it below), a docked Base reacts to whichever note you're reading: a permanent side panel that updates as you move around your vault.
(There's also a Bases: Insert new base command that creates a fresh Base and embeds it at your cursor in one step.)
Bases are only as good as your properties
A Base is a lens. Point a lens at something out of focus and you get a blurry picture, no matter how good the lens is. Your notes' properties are the focus. If half your book notes use author and the other half use authors, if some have rating as a number and others as stars in the body text, if status is "reading" in one note and "Reading" in another, your Base will be a mess. Not because Bases are bad, but because the data underneath is inconsistent.
This is the single biggest reason Bases disappoint at first. The views go up before the metadata is clean, so they faithfully display a mess.
So before you go deep on Bases, do the boring work:
- Decide your properties per note type. Books get
author,status,rating,pages,date_started,date_finished. Pick names and stick to them. - Use the same values. If
statuscan be "To Read", "Reading", or "Read", make those the only three values. Templates help enormously here, because every new note starts consistent. - Give every column a display name. In the Base, never let a raw
health_sleep_total_minutesleak into the UI. Set adisplayNameof "Sleep Hours". Every property you surface should have a friendly, Title-Case label.
Bases will punish every inconsistency you have. That sounds like a downside. It isn't. Bases made me a better note-taker, not just a better dashboard-builder, because they gave me an immediate, visual reason to keep my metadata clean. The dashboard is the reward for the discipline.
Start simple. Clean up the properties of one note type, build one Base on top, and notice the difference. Then expand.
By the way, this is also why I advocate so much to get support for strongly typed notes in Obsidian and why I've actually built the Obsidian Starter Kit plugin for Obsidian.
Formulas and functions: where lists become dashboards
Filtering and sorting give you better lists. Formulas turn those lists into dashboards.
Before the examples, it helps to know that a Base column can come from three places:
- Note properties are your own frontmatter. You reference them by name, with no prefix:
author,status,rating, and you can change the display label (e.g.,Sleep Hoursvssleep_hours) - File properties come from the file itself:
file.name,file.folder,file.ext,file.size,file.ctime,file.mtime,file.tags,file.links. You get these for free on every note. - Formula properties are virtual columns you define. They don't exist in any note; the Base computes them on the fly. Reference another formula with
formula.<name>.
That third kind is really powerful. It enables combining fields, making calculations, transformations, formatting, etc.
Writing a formula
Open the Properties menu in the toolbar, choose Add formula, give it a name, and type an expression. A green checkmark means the syntax is valid. A simple one:
price_label: if(price, "$" + price.toFixed(2), "")That reads the price property and, if it exists, shows it as $19.90. If not, it shows nothing. You have the usual operators to work with: arithmetic (+ - * /), comparison (> < == !=), and boolean (! && ||).
The function toolbox
Functions are what make formulas expressive. A handful are global, called on their own: if(), now(), today(), date(), duration(), link(), image(). The rest are called on a value, method-style, and which ones are available depends on the value's type:
- Date:
.format("YYYY-MM-DD"),.relative()(gives you "3 days ago"), and fields like.year,.month,.day. - String:
.contains(),.startsWith(),.lower(),.title(),.replace(),.split(),.slice(). - Number:
.round(),.floor(),.ceil(),.abs(),.toFixed(2). - List:
.filter(),.map(),.reduce(),.sort(),.unique(),.join(),.contains(),.length. - File:
.hasTag(),.hasLink(),.inFolder(), plus fields like.name,.mtime,.tags,.links. - Link:
.asFile(),.linksTo(). - Object:
.keys(),.values(),.isEmpty(). - Regex:
.matches().
The full reference is in the official docs (linked at the end). You don't need to memorize it; you need to know the categories exist so you know what's possible.
A few gotchas that cost me time early on, worth internalizing:
- There's no standalone
length()oryear(). Use.lengthon a string or list, and.yearon a date. - It's
file.links(outgoing) andfile.backlinks(incoming), notoutlinks/inlinks. - Numbers use methods, not functions:
value.round(), notround(value). - A formula can reference another formula (
formula.x), but never itself, directly or indirectly.
Real formulas from my vault
Here's a real formula from my Health Base (included in the Obsidian Starter Kit). It reads the sleep, energy, and mood I logged in a daily note and computes a single wellness score:
wellness_score: if(health_mood && health_energy_level && health_sleep_total_minutes,
  ((number(health_mood) + number(health_energy_level) +
    if(number(health_sleep_total_minutes) >= 420, 10,
    if(number(health_sleep_total_minutes) >= 360, 7,
    if(number(health_sleep_total_minutes) >= 300, 4, 2)))) / 3).round(),
  "Incomplete Data")
No note contains a "wellness score". The Base computes it from data I already captured. And that's what I love about formulas.
Two patterns I reuse everywhere:
Time bucketing. I have a time_recency formula that turns a note's date into a label like 10 - 🆕 Today, 20 - 📅 This Week, 30 - 📆 This Month, and so on. I then group any view by that formula, and suddenly every dashboard has clean "Today / This Week / This Month" sections without any manual sorting.
Reading duration. My Books Base computes how long each book took:
days_reading: if(date_started,
  if(date_finished, (date(date_finished) - date(date_started)).days,
                    (today() - date(date_started)).days), 0)
If the book is finished, it measures start to finish. If I'm still reading, it measures start to today. That way the information is always current & relevant.
Grouping and summaries: from list to report
Two view options turn a flat list into a real dashboard: grouping and summaries.
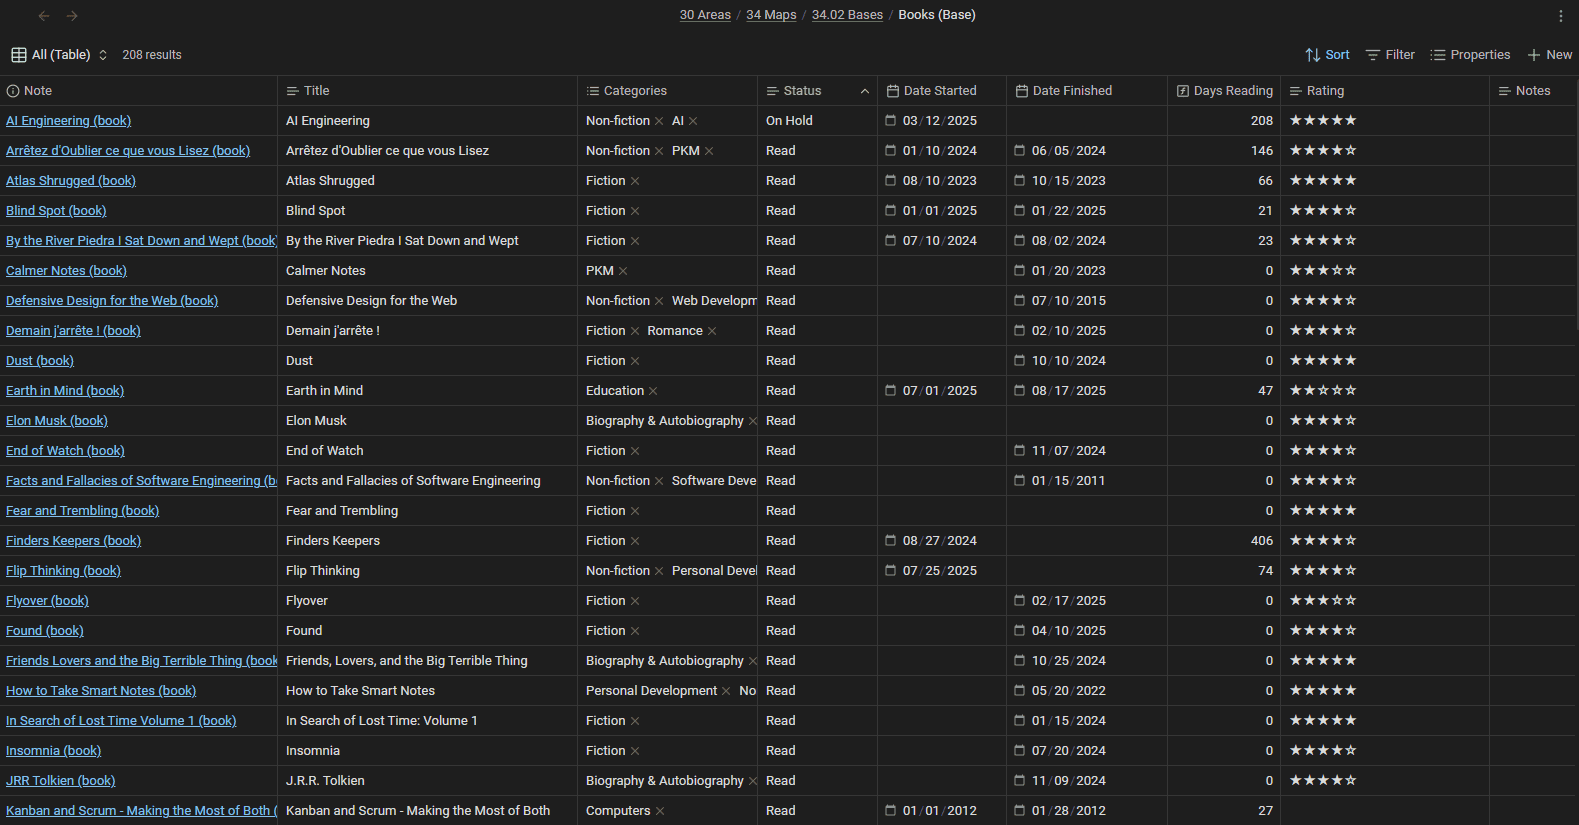
Grouping collapses your rows into sections by a property. Group your Books view by status and you get "Reading", "To Read", and "Read" as headers with their books underneath. Group a daily-notes view by my time_recency formula and every entry files itself under "Today / This Week / This Month". You set it with the Group by control in the view (or groupBy in the raw syntax).
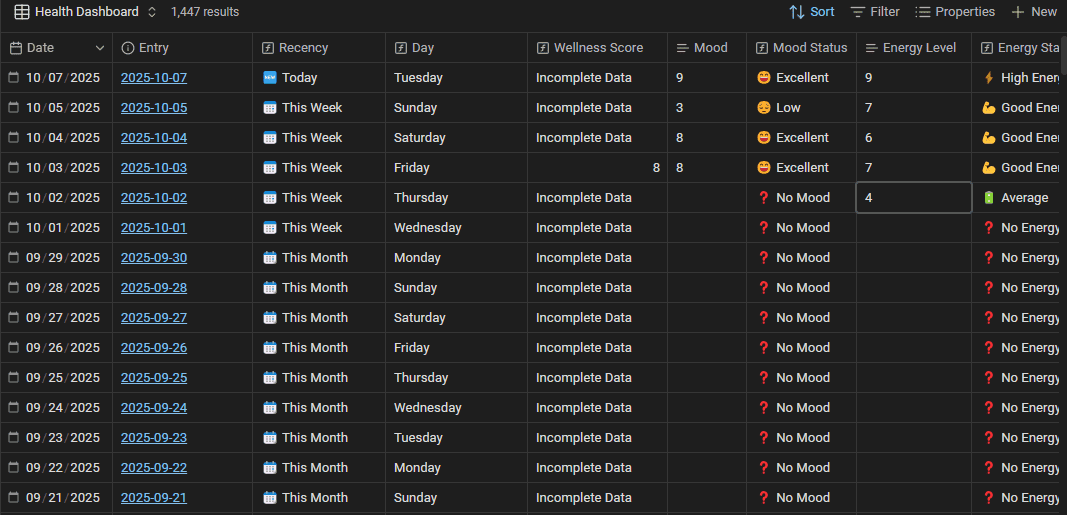
Summaries compute one value per column, shown at the foot of a table; and when a view is grouped, at the foot of each group. Count the rows, sum the pages, take the median sleep, average a score. My "Read This Year" view sums total books and total pages. My Health Dashboard groups days by recency, then shows the median mood, energy, and sleep for each group, so I can compare this week against last month at a glance.
Summaries are set per view, per column, so the same property can show a sum in one view and a median in another. Grouping gives you the sections; summaries give you the numbers per section. Together they turn a list of entries into something you can actually read.
A useful convention
Bases sort text columns by character code. So if you label your buckets with emoji first (🆕 Today, 🔴 Overdue, 📅 This Week), they sort by the emoji's code point, not by the order you actually want.
The fix is a small convention I apply to every rankable formula: prefix the label with a two-digit number. 10 - 🆕 Today, 20 - 📅 This Week, 30 - 📆 This Month. Use 10, 20, 30 rather than 1, 2, 3 so you can introduce a 15 in later without renumbering everything. Reserve 99 for "unknown" or "no data".
This is the same convention that my Obsidian Starter Kit uses for statuses like 10 - Backlog and 60 - Completed, and it's worth adopting from the get go.
When Bases beat Dataview (and when they don't)
If you've been using Obsidian for a while, you've probably used the Dataview. So the obvious question: should you switch? Here's my opinion on that...
Reach for Bases when:
- You want a visual, sortable, native dashboard with zero code.
- You want to edit values directly in the view (Dataview is read-only; Bases let you change a property in the table and it writes back to the note).
- Performance matters. Bases are fast, even on a 20,000-note vault, even on mobile.
- You want to be able to tweak it through a user interface.
Still reach for Dataview (or DataviewJS) when:
- You need logic that Bases formulas can't express yet.
- You want inline queries woven into the prose of a note rather than a standalone view.
- You already have complex queries that work and aren't worth rewriting.
One caveat on that editing point: not every column is editable in place. Formula columns are computed, so they're read-only by nature. A few file properties (the file's path, for instance) can't be changed from the table either. But your own note properties; text, numbers, dates, checkboxes, tags; those you can edit right there in the view, and the change writes straight back to the note.
I still use the Dataview a lot, combined with my Dataview Serializer plugin for Obsidian (for portability & data longevity). But I now leverage Bases for many use cases instead of Dataview. For roughly 80% of what I want from a dashboard (filtered, sorted, grouped views over typed notes), Bases is the better choice in 2026. Faster, native, editable, and no query language to learn.
Just choose the right tool for the right job.
Example 1: A reading library that maintains itself
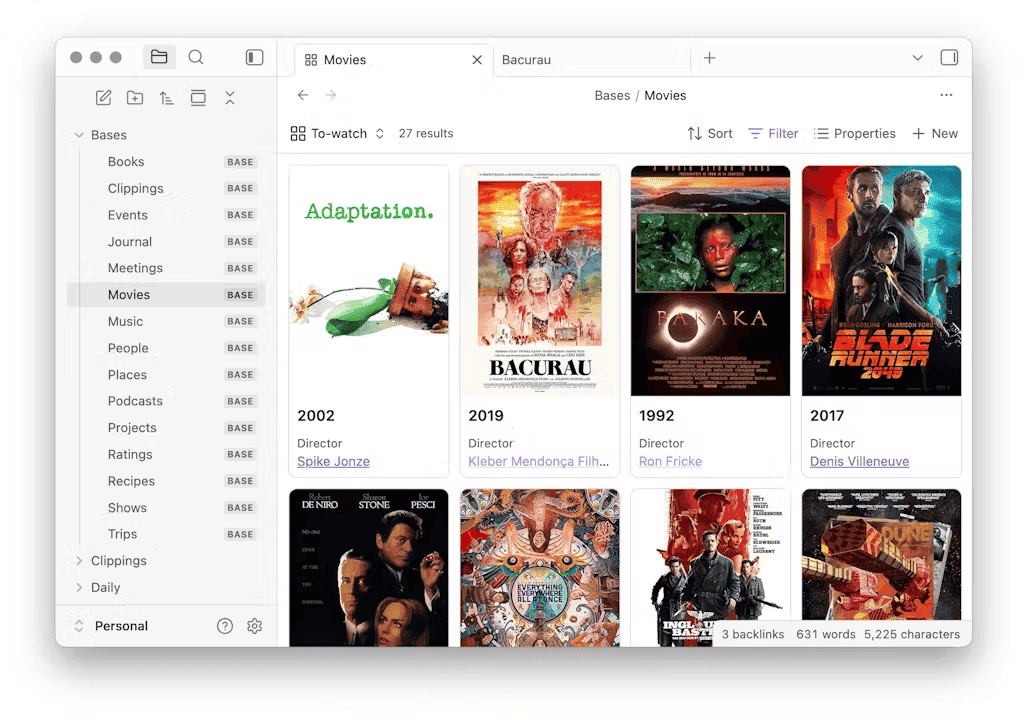
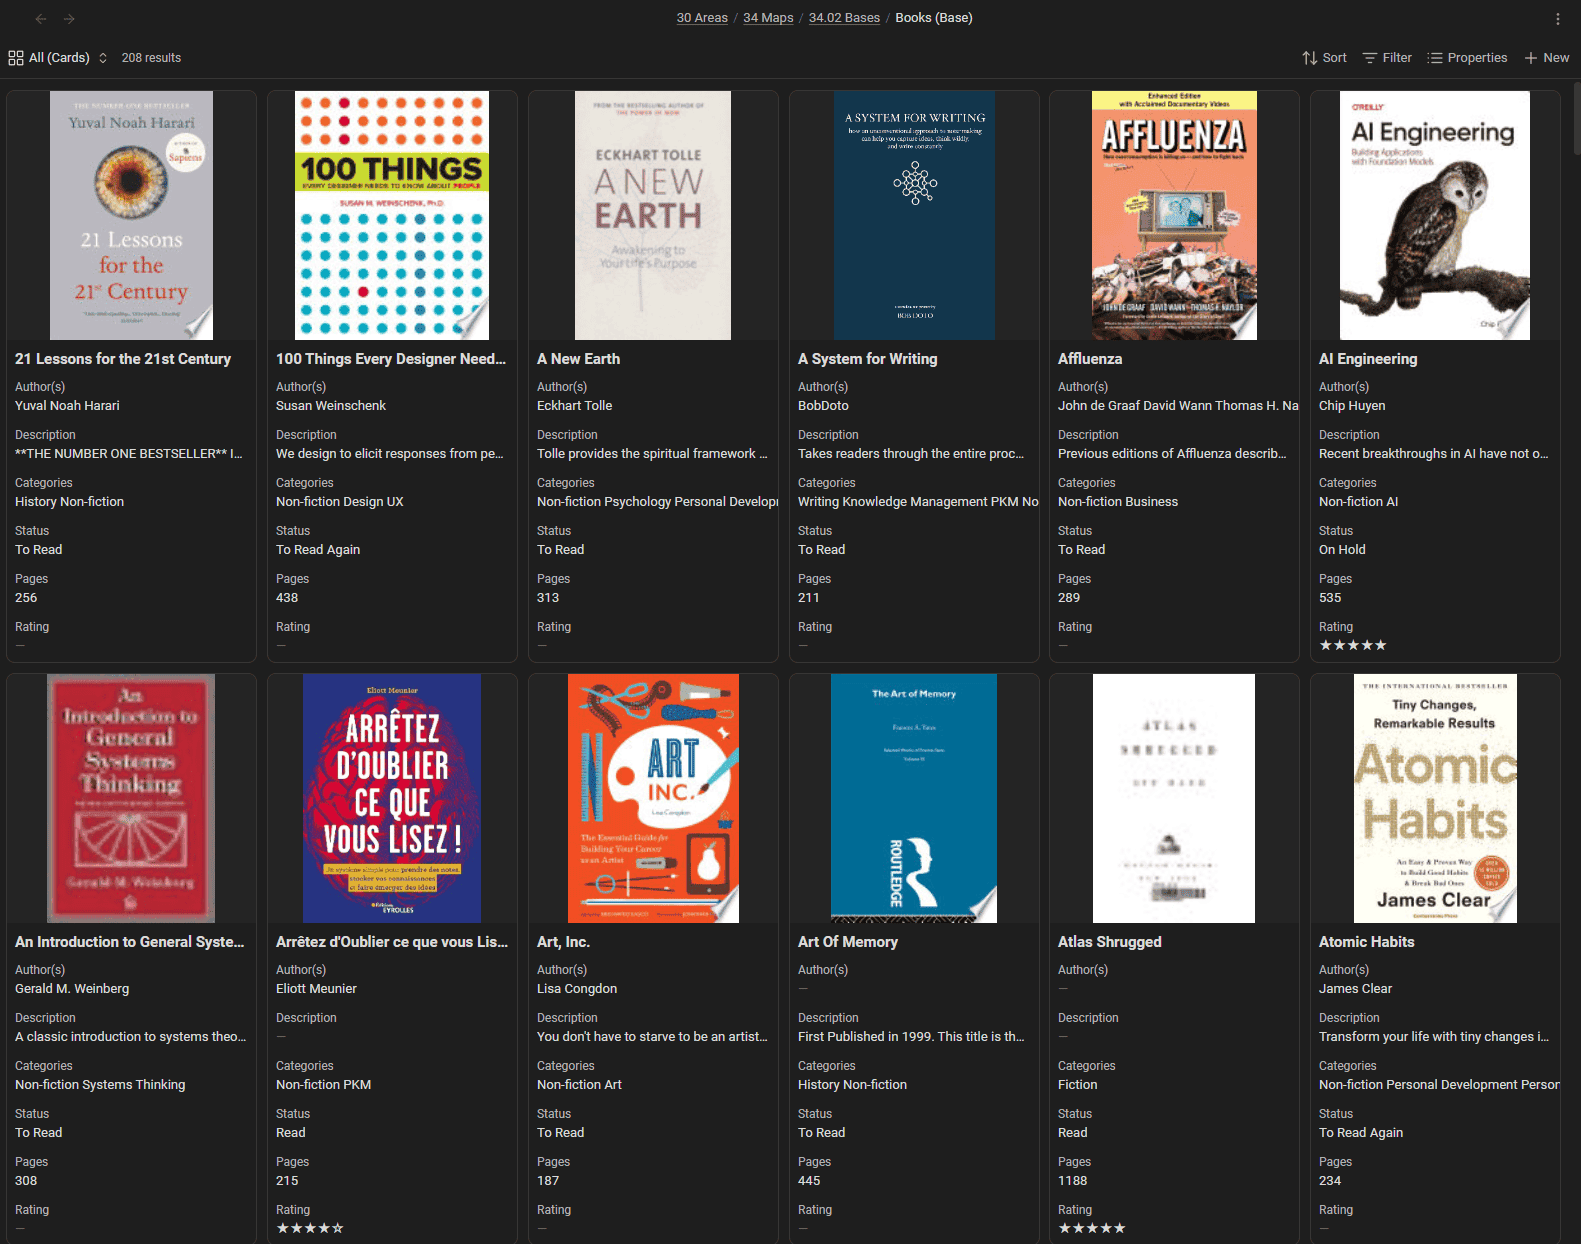
My Books Base is the friendliest example of the "one Base, many views" idea.
The filter is simple: notes tagged as books. From there:
- A Cards view uses each book's cover image (a property pointing to a local image or URL) for a visual gallery.
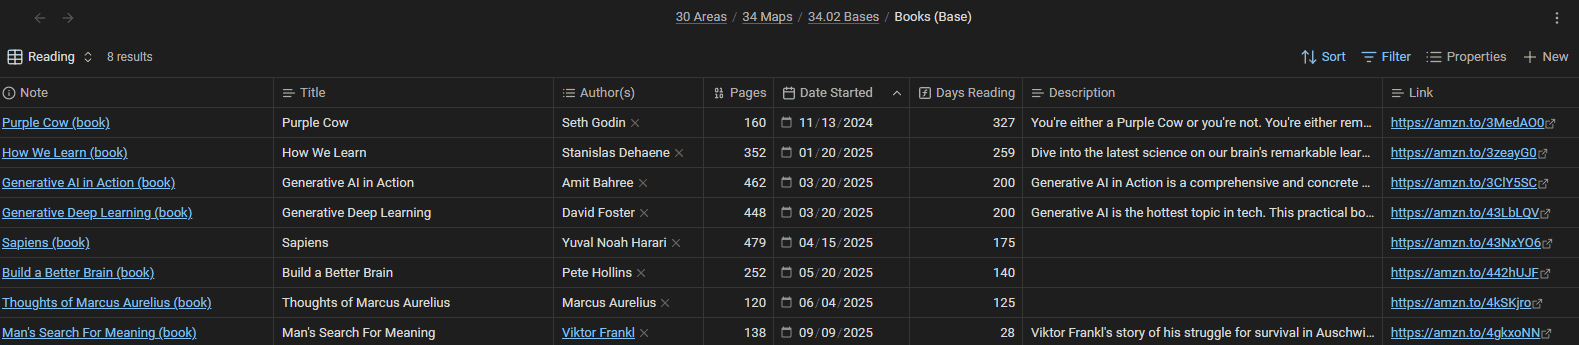
- A Currently Reading table shows only books with
status: Reading, plus thedays_readingformula so I can see what's been sitting half-read for four months. - A Read This Year table filters to books finished since January 1st, with summary rows totaling the number of books and pages. The footer literally adds up my year of reading.
- Separate fiction and non-fiction galleries, each just a filtered view of the same Base.
I never "organize" my reading list. I change a book's status property when I start or finish it, and every view updates itself. The database does the filing. Also, since all my book notes are Markdown files, I can just ask AI to update the properties for me.
Example 2: A health dashboard on top of daily notes
This is the Base I open most. My daily notes carry tons of health-related properties: sleep, mood, energy, stress, steps, and a lot more (many of which are synced automatically from my smart watch). I never created a "health database". The data was already in my daily notes. I just created a Base that leverages the data.
That single Health Base has more than a dozen views, all over the same daily notes:
- A Health Dashboard grouping every day by recency, with computed status columns (mood, energy, sleep, stress, ...) and median summaries.
- A Sleep Tracking view with sleep stages, quality, and interruptions.
- An Exercise Tracking view that sums steps, distance, reps, active minutes, etc.
- A High Wellness Days view filtered to days where my computed wellness score was 7 or higher, so I can study what made the good days good.

The lesson generalizes: if you're already capturing structured data in your daily notes, you're already sitting on a database. A Base is how you get it all visible in one place.
But wait, there's actually much more you can do with Bases!
Example 3: Custom Base views
Bases ship with Table and Cards views, with more coming from the Obsidian team (e.g., a Kanban view type they're working on). But the Obsidian team isn't the only one who can add views. Plugins can add entirely new Base view types, so the same query you already wrote can be rendered in completely new ways.
For instance, the TaskNotes plugin for Obsidian comes with multiple new Base view types: a Kanban board for your tasks, a calendar, a tasks list, ...
Actually, I cared about this enough to build multiple Obsidian plugins that also add new Base view types.
Life Tracker plugin for Obsidian adds a "Life Tracker" Base view that turns tracked properties into charts: heatmaps, line, bar, area, radar, and more (twelve visualization types in total). Point it at the same daily-note data my Health Base reads, and instead of a table I get GitHub-style heatmaps of my habits and trend lines for sleep, energy, and weight.
That plugin also provides a data entry view:
This goes further than merely listing the notes filtered by the base; it enables editing and validating all health-related properties.
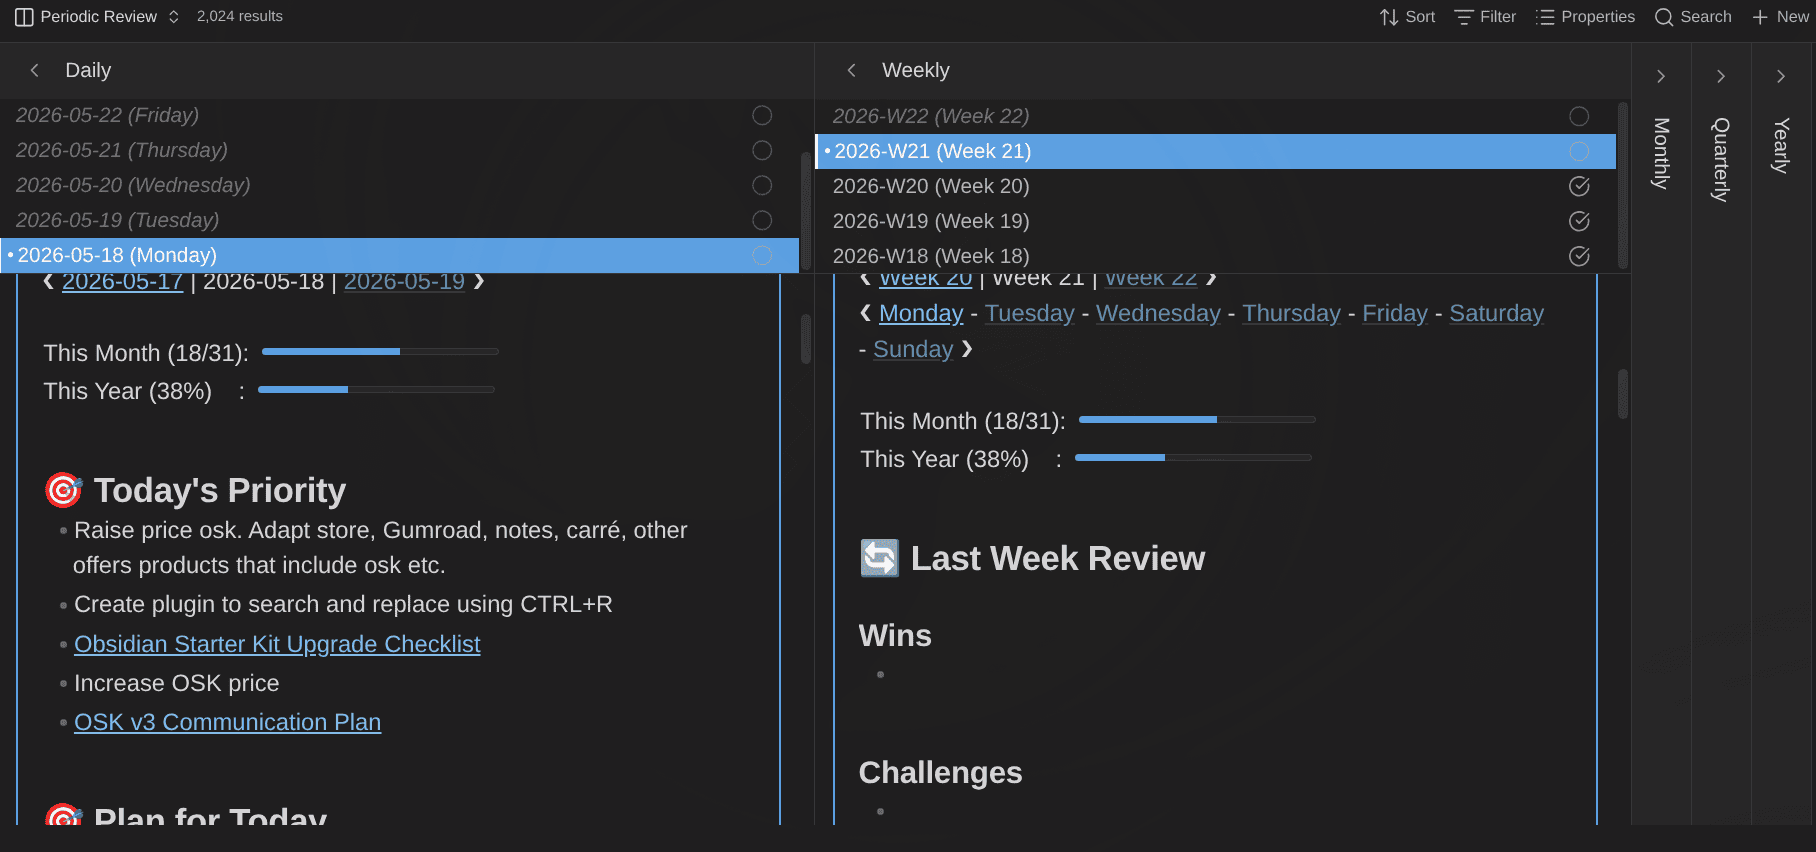
Journal Bases plugin for Obsidian adds purpose-built views for daily, weekly, monthly, quarterly, and yearly notes, plus a periodic-review view. It makes navigating and running Periodic reviews feel native instead of like wrangling a generic table. It's a clearly-defined process turned into a Base view.
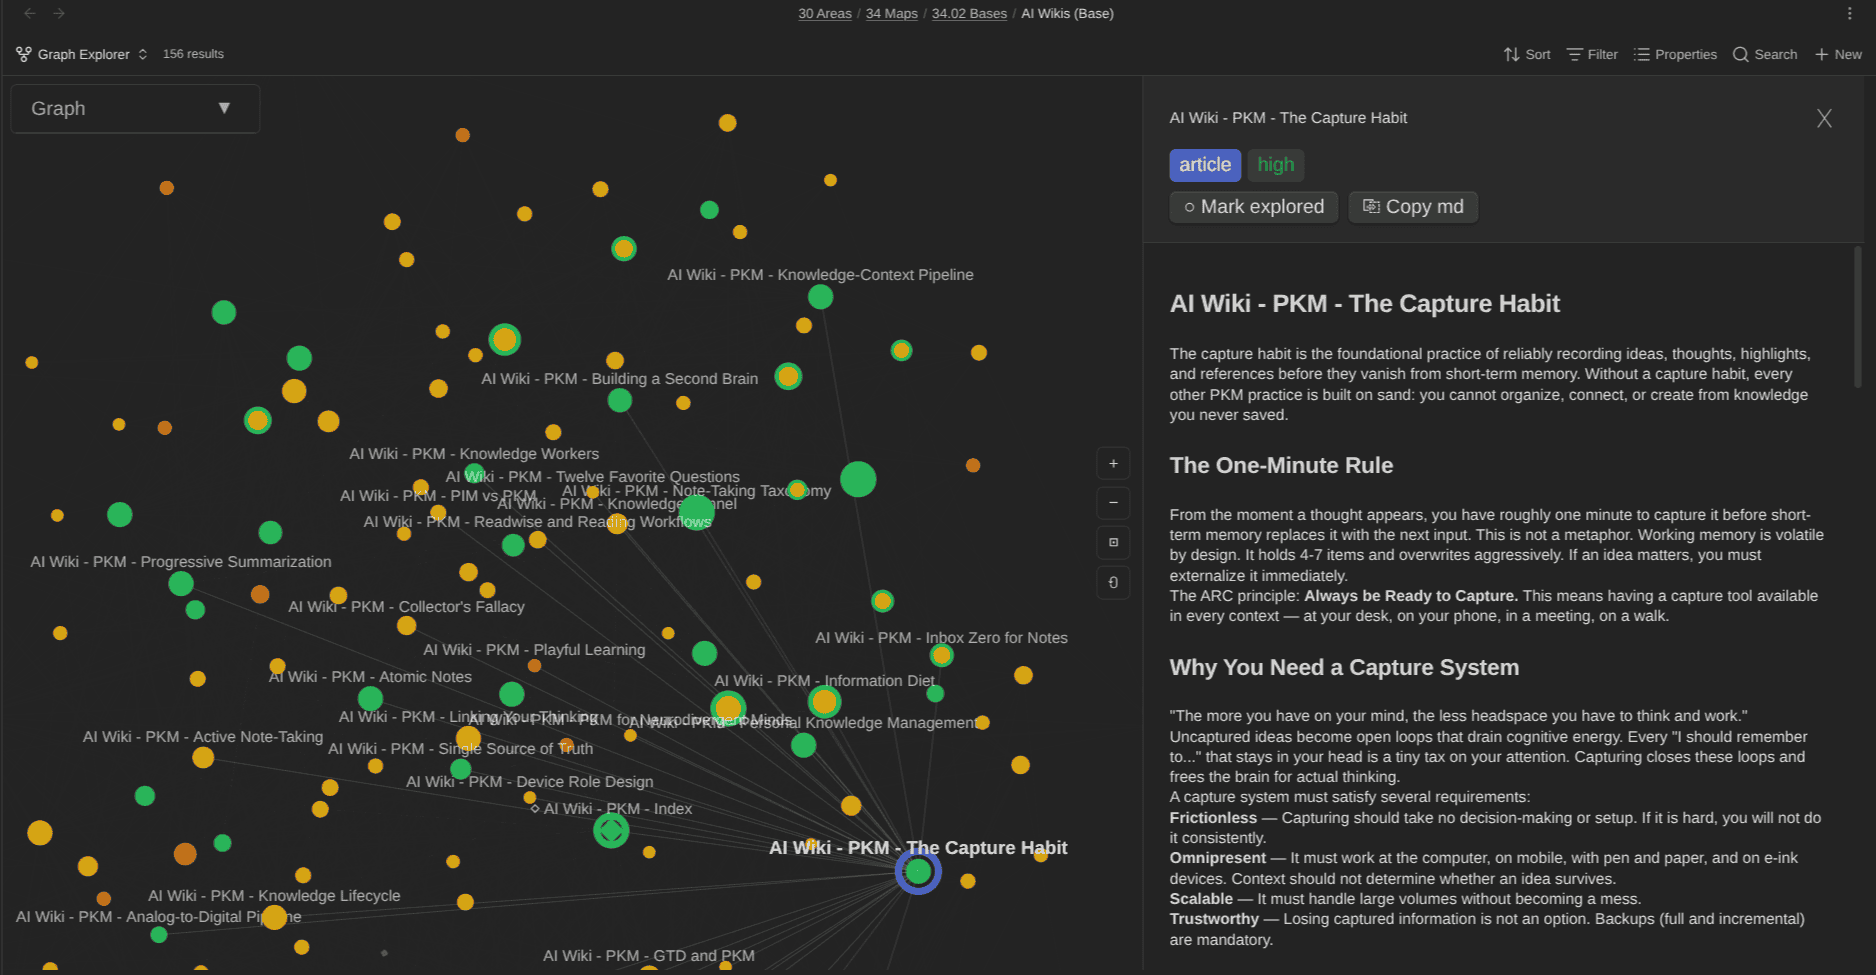
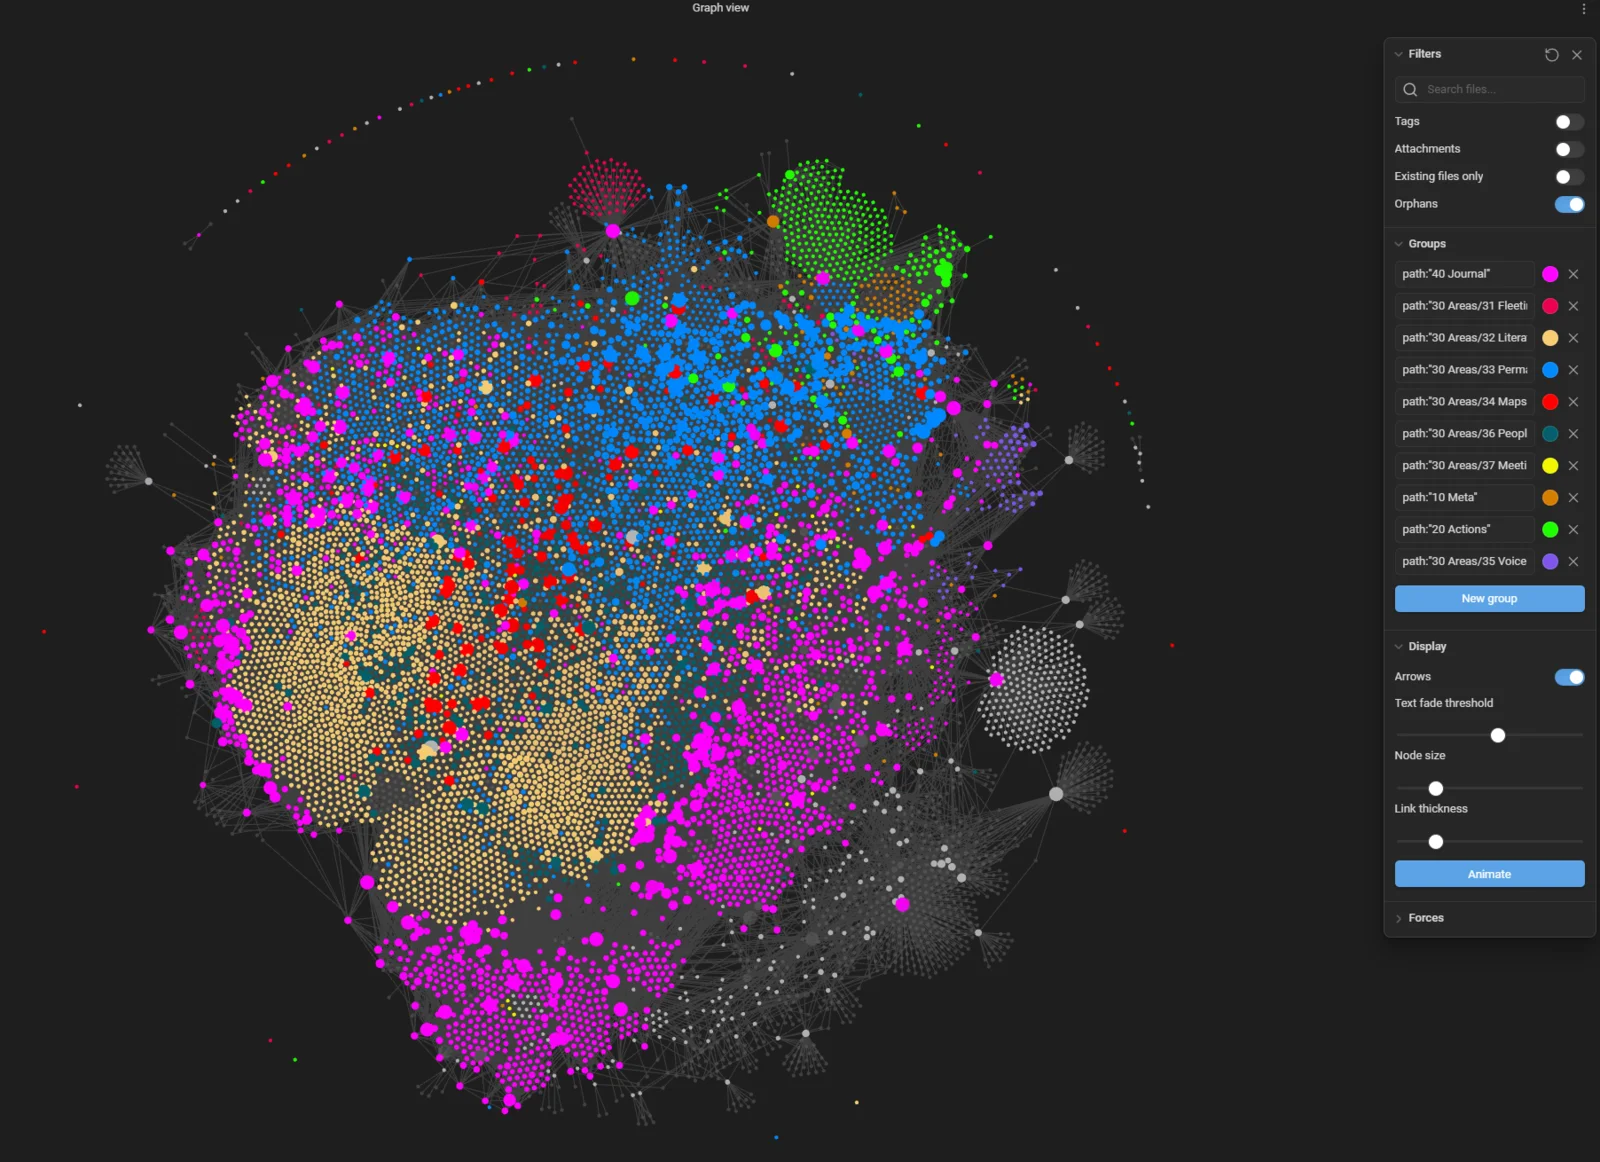
Graph Explorer Base View plugin for Obsidian renders any Base as an interactive force-directed graph. Each note becomes a node, each link an edge. You can color nodes by any property, track which ones you've reviewed, and spot clusters and gaps at a glance. I built it for navigating AI-maintained wikis, but it works on any set of notes.
The point isn't "use my plugins". The point is that a Base is a stable, reusable query, and plugins can add new view types that enable visualizing/editing/... those notes in various ways. Your data remains in the notes themselves while the way to look at it keep multipliying.
Example 4: The AI Base
This is another Base that I've created for my own needs recently.
My vault doesn't just hold notes. It holds AI agents, AI skills, commands, memory, etc. So I built a Base that indexes all of it.
The filter targets those hidden paths:
filters:
  and:
    - file.ext == "md"
    - or:
        - file.path.startsWith(".claude/agents/")
        - and:
            - file.path.startsWith(".claude/skills/")
            - file.name.startsWith("SKILL")
        - file.path.startsWith("10 Meta/99 AI Assistant/")
Then, formulas classify each file. One reads each skill's metadata.capability and groups by domain. Another computes a freshness label from the file's modification date (10 - 🟢 Fresh, 20 - 🟡 Recent, all the way to 50 - ⚫ Very Stale). A "Needs Attention" view surfaces stale agent memory and aging skills automatically.
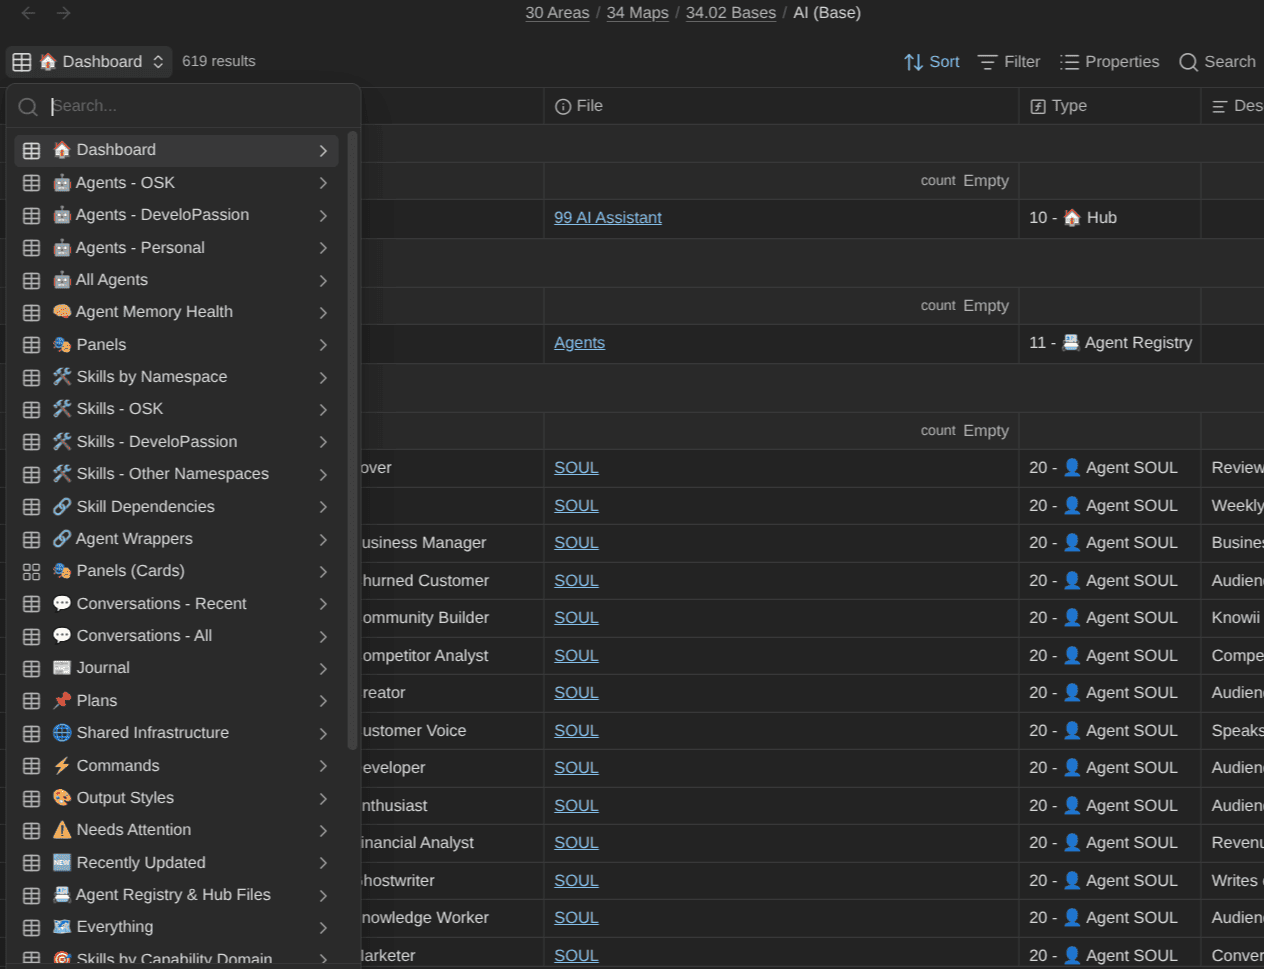
The result is a control panel for the AI system inside my vault, built entirely with a Base. No new app. No external dashboard. Just a query over Markdown files, including the ones Obsidian normally indexes nor shows.
This is what I mean when I say Bases are a lens. The same primitive that lists my books also runs the cockpit for dozens of AI agents. (If you want the full picture of how AI lives inside the vault, that's the AI Assistant System in the Obsidian Starter Kit, and the broader set of OSK systems each lean on Bases in their own way.)
Bases beyond the app: the Obsidian CLI
Another awesome fact is that Bases aren't trapped inside the Obsidian app window. Using the official Obsidian CLI, you can actually query your Bases from the terminal (and/or from AI tools such as Claude Code, OpenAI Codex, GitHub Copilot, OpenClaw, Hermes, ...).
A few commands worth knowing:
# List every .base file in the vault
obsidian bases

# List the views inside the current base
obsidian base:views

# Query a base and get the results as JSON, CSV, or Markdown
obsidian base:query file="30 Areas/34 Maps/34.02 Bases/Books (Base).base" view="Read This Year" format=json
That last one is the interesting one. base:query loads your Base, and gets data out of it:
❯ obsidian base:query file="30 Areas/34 Maps/34.02 Bases/Books (Base).base" view="Read This Year"

[
  {
    "path": "30 Areas/32 Literature notes/32.03 Book notes/The Night Window (book).md",
    "Note": "The Night Window (book)",
    "Title": "The Night Window",
    "Author(s)": "[[Dean Koontz]]",
    "Categories": "Fiction",
    "Pages": "610",
    "Pages (This Year)": "610",
    "Date Started": "2026-06-18",
    "Date Finished": "2026-06-23",
    "Days Reading": "5",
    "Rating": "★★★☆☆",
    "Notes": null
  },
  {
    "path": "30 Areas/32 Literature notes/32.03 Book notes/Never Lie (book).md",
    "Note": "Never Lie (book)",
    "Title": "Never Lie",
    "Author(s)": "Freida McFadden",
    "Categories": null,
    "Pages": "0",
    "Pages (This Year)": "0",
    "Date Started": "2026-06-01",
    "Date Finished": "2026-06-05",
    "Days Reading": "4",
    "Rating": null,
    "Notes": null
  },
  ...
]
You can then pipe the results to whatever you want: a script, an automation, an AI tool. Your "Read This Year" view can feed a year-in-review post. Your tasks Base can feed a morning briefing. The Base becomes a reusable data source for the world outside Obsidian, not just a view inside it.
This is the bridge between "pretty dashboard" and "automation building block", and it's a big part of why I lean on Bases so heavily.
Dynamic Bases with this
Let's discuss about a really cool feature of Obsidian Bases.
When you embed a Base inside a note, the Base can refer to that note as this. When the Base sits in your sidebar, this becomes whichever note you're currently looking at (i.e., the currently active/focused note).
That means a single Base can adapt its content to your context. The classic example is a smarter backlinks panel:
filters:
  and:
    - file.hasLink(this)
Drop that Base in your sidebar and it always shows the notes that link to whatever you're reading. Open a different note, and it updates itself. One Base, infinite contexts.
Instead of building a dashboard per note, you build one context-aware Base and let this do the work. It's one of the most underused features in all of Bases.
As an example, in my vault, I have a "Dynamic" Base that heavily uses the this keyword. Here's what its "Tags" view shows for this very article:
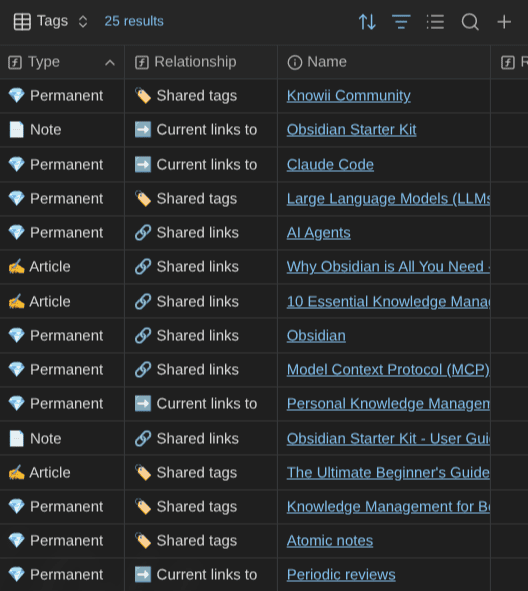
That "Tags" view lists all the notes that have a relationship of some kind with the current note.
Tips & tricks worth knowing
A few small quality-of-life things I've picked up along the way. None of them are essential. All of them make working with Bases nicer day to day. Most are tucked away in menus and settings, so they're easy to miss.
- Rename a view in one click. Right-click the view's button at the top to start editing it directly, no menu digging required.
- Reset a column width instantly. Double-click a column divider in a table view and it snaps back to its default width. Very handy after you've been dragging things around.
- Control the row height. Table views let you change the row height in the view settings. Compact when you want a dense dashboard, taller when you want some breathing room.
- Tune your card galleries. In a Cards view's settings, you can set both the cover image property and the card aspect ratio, so your bookshelf or gallery looks exactly the way you want it to.
- No cover image? Use a color. The property feeding a Cards view's cover doesn't have to be an image. A hex color code works too (e.g.,
color: "#4555dd"). Perfect for notes that have no natural thumbnail; color-code them instead. - Reorder properties with the keyboard. With the Properties menu open, move through the list with the arrow keys, and hold
Alt/Optto push a property up or down. Much faster than the mouse once your views get long. - Edit notes just by hovering. If you have the Page Preview core plugin enabled, turn off Bases' "Require Ctrl to trigger preview" option. Now you can see and edit a note's preview simply by hovering over it in the Base, no clicking through.
- Make Bases match your theme. The whole look and feel can be customized through CSS variables (linked in the references). If you live in your dashboards like I do, it's worth a few minutes to make them truly yours.
Small stuff, but it adds up.
Let AI build Obsidian Bases for you
Writing Base syntax by hand is fine once you know it, and the user interface makes it a breeze to create or update one. But it takes time, and it's easy to break things.
Steph Ango (Obsidian's CEO) published a set of open AI Agent Skills: Obsidian AI Skills by Steph Ango. Those include an obsidian-bases skill that teaches an AI assistant how to construct and edit .base files: views, filters, formulas, and summaries included. You can find them at github.com/kepano/obsidian-skills.
With a skill like that loaded, building a Base becomes a conversation. "Make me a Base that shows my unfinished projects grouped by priority, with a column for days since last touched." The AI writes the .base file, formulas and all. You review it, tweak it, ship it.
This is exactly how I work. I describe the dashboard I want in plain language and let AI draft the syntax, then I refine. It collapses the learning curve to almost nothing. The formulas I showed you earlier? You don't have to memorize that syntax anymore. You have to know what question you want to ask. The AI handles the grammar.
Bases made dashboards code-free. AI is now making them description-free.
AI does make mistakes, it's not perfect. But with a few attempts you'll quickly get to what you want. And it'll be even faster if you have clearly-defined note types like I have created for myself with the Obsidian Starter Kit.
Going further
If you want a vault that's set up for all of this out of the box (typed notes with consistent properties, 20+ ready-made Bases for books, health, people, tasks, and more, plus the AI layer that makes the AI Base possible), that's exactly what I've built into the Obsidian Starter Kit.
The Starter Kit ships first-class Bases support across every system, so you get the property discipline and the dashboards without assembling them yourself.
And if you want to go deeper with a community of people building knowledge systems like this, come hang out in Knowii.

I also send a weekly newsletter on knowledge management, Obsidian, and AI-augmented thinking.

Conclusion
Obsidian Bases aren't a spreadsheet you fill in. They're a lens you point at notes you already have. Get that one idea right and everything else follows.
The order that works: clean up your properties first, build one Base on top, add views instead of more Bases, then let formulas turn those views into real dashboards. Once that foundation is solid, Bases scale effortlessly, from ten notes to twenty thousand or more; from a reading list to a cockpit for the AI agents living in your vault.
Start with one note type. Tidy its properties. Build one Base. You'll feel the shift immediately, and you'll never look at your vault as a pile of files again.
That's it for today! ✨
About Sébastien
I'm Sébastien Dubois, and I'm on a mission to help knowledge workers escape information overload. After 20+ years in IT and seeing too many brilliant minds drowning in digital chaos, I've decided to help people build systems that actually work. Through the Knowii Community, my courses, products & services and my Website/Newsletter, I share practical and battle-tested systems.
I write about Knowledge Work, Personal Knowledge Management, Note-taking, Lifelong Learning, Personal Organization, Productivity, and more. I also craft lovely digital products and tools.
If you want to follow my work, then become a member and join our community.
Ready to get to the next level?
Since you're interested in Obsidian:
- 🚀 Obsidian Starter Kit — Skip weeks of setup with 40+ templates
- 🎬 Obsidian Starter Course — Master Obsidian in 2+ hours
- 📚 KM for Beginners — 10+ hours of structured video lessons
- 🎯 Join Knowii — Community + ALL courses & tools
Found this valuable? Share it with someone who needs it.